- What an HLD Actually Is, and What It Isn't
- What's Included in a Full HLD Design Service
- FTTH-Specific HLD Considerations
- HLD for BEAD Projects: What State Offices Actually Want
- The 5 Things a Bad HLD Gets Wrong
- What the HLD-to-LLD Handoff Should Look Like
- How Draftech Delivers HLD Services
- Starting an HLD Engagement
I've been doing OSP engineering for 17 years, and one pattern I see constantly: ISPs and electric cooperatives commissioning an HLD for an FTTH build without a clear picture of what the deliverable should actually look like. They engage a firm, receive a PDF with some colored lines on a county map, and assume that's what an HLD is. Then construction starts, costs blow out, and the post-mortem reveals that the "HLD" never answered the questions it was supposed to answer.
This post is for anyone who is about to commission an HLD, or who has received one and isn't sure whether it's any good. I'll explain what a proper HLD design service actually delivers, what FTTH-specific decisions it must address, and what the failure modes look like when firms cut corners on the work.
What an HLD Actually Is, and What It Isn't
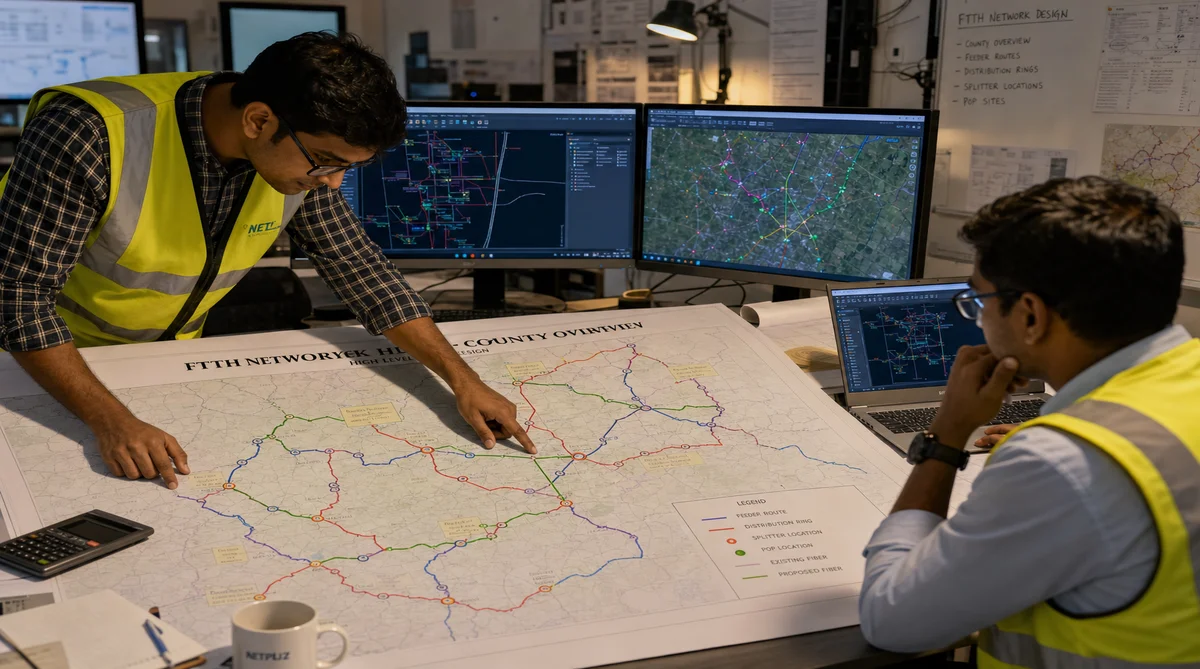
The term "high-level design" gets used loosely enough that it's worth being precise. An HLD for an FTTH network is a decision-making document. It answers the architecture questions that every downstream engineering task depends on: where the fiber routes go, how many fibers are on each segment, where nodes and hubs are positioned, how the PON splits are structured, and which sections go aerial versus underground. Every one of those decisions has cost implications, and most of them are expensive to change once LLD begins.
An HLD is not a sketch. It is not a preliminary route map drawn over a satellite image. And it is not a redline of someone else's cable TV plant. I've seen all three delivered as HLDs. The difference between a sketch and an HLD is that the HLD is a structured engineering analysis: it documents not just what the network will look like, but why it's designed that way, with the technical and economic logic behind each major choice.
How this relates to LLD: If you want to understand the formal distinction between HLD and LLD before going deeper here, our post on the difference between HLD and LLD in fiber design covers the conceptual framework. This post focuses specifically on what a good HLD design service includes: what the firm does, what the outputs are, and what bad HLD work looks like.
What's Included in a Full HLD Design Service
A comprehensive OSP engineering HLD for an FTTH network covers several distinct work areas. Here's what each one entails.
Feeder Route Development
The feeder layer is the backbone of your FTTH plant: the high-fiber-count cables running from your central office or hub sites to the distribution areas. Feeder route planning involves identifying the optimal path from the hub to each distribution zone, considering existing pole infrastructure, underground conduit availability, ROW access, and topographic constraints. On a typical rural FTTH build, feeder cables run 144 to 288 fibers. Getting the route wrong adds cost in two ways: mileage and make-ready. Every extra quarter-mile of feeder is real money, and every extra pole attachment you don't need is a permit you didn't have to pull.
Node Architecture and Placement
An HLD defines the distribution node structure: where optical amplification or splitting occurs, how many serving area interfaces (SAIs) or fiber distribution hubs (FDHs) are needed, and what their geographic footprint is. Node placement drives splice count, drop cable length, and the overall cost per passing. Poorly placed nodes are one of the most common sources of budget overruns in FTTH builds. I've reviewed HLDs where the node placement was based on aesthetics rather than subscriber density: the engineer drew equally-spaced circles on a map instead of modeling where the actual served locations are.
Fiber Count Decisions
This is one of the most consequential decisions in the HLD, and one of the most frequently underspecified. The HLD must define fiber counts for each segment: the feeder, the distribution cables, and the drop allocation. These counts need to be derived from subscriber density modeling and PON architecture, not guessed. Over-fibering wastes capital. Under-fibering means expensive rip-and-replace when you hit capacity. On a 1,200-subscriber rural deployment I worked on, the initial HLD specified a uniform 96-fiber distribution cable throughout. The engineer had just picked a number. Our revised design ranged from 48 fibers in low-density areas to 144 fibers approaching the town center, cutting cable cost by 18% while adding enough capacity headroom for the growth projections.
Splice Point Placement
The HLD defines where splices occur: at node locations, at direction changes, and at the transition from feeder to distribution. Splice spacing matters because each splice enclosure is a cost item in construction and a maintenance point for the life of the network. Good HLD work establishes splice intervals based on cable reel length (typically 3,000 to 5,000 feet depending on cable type), minimizes unnecessary mid-span splices, and positions splice points at accessible locations: poles rather than mid-span, manholes rather than mid-duct.
Aerial vs. Underground Route Decisions
The HLD should make explicit, documented decisions about construction method for each route segment. These decisions depend on existing infrastructure (is there usable strand?), terrain, ROW type, and cost modeling. Underground routes in soft soil can still carry high installation costs. Aerial on existing strand can be a fraction of that. But underground protects against storm damage and often has lower long-term maintenance cost. A proper HLD doesn't leave this to the LLD engineer: it establishes the method and documents the rationale, so construction budgets can be built on real data rather than assumptions. Our [field survey](https://draftech.com/services/field-survey) data feeds directly into this analysis; you can't make good aerial vs. underground decisions without current conditions on the pole plant.
Route Feasibility Assessment
The HLD must flag obvious obstacles: railroad crossings, river crossings, congested aerial plant where make-ready will be heavy, underground segments where existing conduit occupancy is unknown. These items belong in the HLD because they affect the budget estimate and the project schedule, not as surprises during LLD or construction.
FTTH-Specific HLD Considerations
FTTH on a passive optical network has design constraints that don't exist in point-to-point or legacy copper plant. The HLD has to address these explicitly.
PON Architecture Selection
The HLD should specify whether the deployment uses GPON, XGS-PON, or another standard, and document why. This isn't a procurement decision; it's an engineering decision that affects the optical link budget, the split ratios the design can support, and the capacity available per subscriber. XGS-PON at 10 Gbps symmetrical has different design implications than GPON at 2.5/1.25 Gbps, even when the physical plant looks identical. The HLD needs to model both directions.
Split Ratio Modeling
A standard GPON network supports up to 128:1 splitting, but deploying at 128:1 means every subscriber on that PON shares a 2.5 Gbps downstream pool. Most operators target 32:1 to 64:1 in practice, depending on their service tier commitments and subscriber density. The HLD must define the split ratios for each distribution area, because split ratio determines how many OLT ports you need, how many FDH enclosures you'll deploy, and what the optical power budget is at the subscriber's ONT. Get this wrong in the HLD and you're either over-provisioning OLT capacity or discovering at activation that your link budget is 3 dB short.
FDH and FDT Placement
Fiber distribution hubs (FDHs) and fiber distribution terminals (FDTs) are the physical manifestation of your PON split structure. Their placement drives drop cable length, which drives per-subscriber cost. The HLD should model FDH locations to minimize weighted average drop distance across all subscribers in each serving area. In a rural deployment with dispersed housing, this analysis can significantly reduce drop cable cost, sometimes by several hundred dollars per subscriber compared to a layout that wasn't optimized.
For more on FDH sizing specifically, our post on fiber distribution hub sizing for FTTH PON covers the sizing methodology in detail.
Subscriber Density Modeling
Good HLD work is grounded in real subscriber location data, not county parcel counts or census estimates. We geocode actual addresses, identify the served locations in the project footprint, and model the distribution design around where people actually live. In rural areas, this often produces a fundamentally different distribution design than one based on population density maps, because the real locations are clustered in ways that don't show up in aggregate data.
HLD for BEAD Projects: What State Offices Actually Want
BEAD-funded deployments have specific HLD requirements that commercial builds don't face. If you're a subgrantee preparing your engineering package, the HLD is a compliance document as much as a design document. Our post on fiber network HLD requirements for BEAD subgrantees goes into this in full detail, but the key points:
NTIA-Aligned Documentation
The NTIA's Notice of Funding Opportunity and state-level program requirements don't use the term "HLD" explicitly, but the engineering content they require is HLD work: network topology documentation, technology selection justification, coverage area definition with BSL (Broadband Serviceable Location) mapping, and cost modeling tied to the engineering design. Your HLD package needs to be structured so that a state broadband office reviewer can trace the engineering logic from subscriber location to network architecture to cost estimate.
GIS Deliverables
Every BEAD state program I've worked with requires GIS deliverables formatted to their specific schema. This is not a conversion from AutoCAD at the end of the project. The HLD should be developed natively in GIS (ArcGIS or equivalent) so that the spatial data is accurate and complete from the beginning. State schemas vary, but typically require fiber route centerlines with segment attributes, node and hub points with equipment specifications, splice locations, and service area polygon coverage tied to the BSL fabric.
For more on the engineering requirements tied to BEAD funding, see our full post on BEAD engineering requirements in 2026.
PE Review Triggers
Some state BEAD programs require PE (Professional Engineer) review and stamp on the engineering package before subgrant execution. The HLD is typically included in that review. This means it needs to be a real engineering document, not a colored route map and a narrative. If you're working with an engineering firm that can't produce a PE-stamped HLD package, that's a problem you'll discover at the worst possible moment.
BEAD timeline trap: State broadband offices are seeing HLD packages submitted in AutoCAD DWG format when their schema requires ESRI geodatabase. The conversion isn't trivial: it introduces attribute errors and geometry issues. Build GIS-native from day one, or plan for a rework cycle that costs you schedule time you don't have.
The 5 Things a Bad HLD Gets Wrong
After reviewing a lot of HLD packages (both ones my team produced and ones clients brought to us after getting burned), I've seen the same failure modes repeat. These aren't opinions about style. They're problems that translate directly into construction budget overruns and project delays. Our post on common FTTH HLD design mistakes covers some of these with more depth, but here's the core list:
1. No Fiber Count Logic
The most common deficiency I see: fiber counts specified as round numbers with no derivation. "144-fiber feeder" because that's a standard cable size, not because anyone modeled the subscriber density and PON architecture. Fiber count decisions in an HLD should be traceable: you should be able to see the subscriber count, the split ratio, the distribution architecture, and the resulting fiber demand on each segment. If you can't, the number is a guess.
2. Node Placement Based on Geography, Not Demand
Drawing node locations on a map based on geographic centrality rather than subscriber clustering produces a design that looks balanced but performs poorly on cost. Nodes should be positioned to minimize weighted drop cable length across the actual served locations. In terrain-constrained areas, this sometimes means a non-obvious node location that significantly reduces construction cost compared to the "obvious" spot in the center of a serving area.
3. Missing Route Feasibility Flags
An HLD that doesn't identify railroad crossings, river crossings, or segments with heavy make-ready burden gives the client a false cost picture. These obstacles don't disappear; they just show up later as change orders. Part of the HLD work is reviewing the route against known permit and construction constraints and flagging anything that carries above-average cost or schedule risk.
4. Aerial vs. Underground Left Ambiguous
When the HLD says "aerial or underground TBD per field survey," that's not a design decision. It's a deferral. Underground construction can cost more than aerial construction, with the difference driven by terrain and existing infrastructure. If you're building a budget estimate from an HLD that hasn't made this call, your estimate has a very wide error bar. Good HLD work makes the call, documents the basis, and flags any segments where field survey data needs to be collected before the decision can be finalized.
5. Optical Link Budget Never Modeled
On a PON network, the optical link budget determines whether your design will actually work. It's the calculation that accounts for fiber attenuation (typically 0.35 dB/km for single-mode at 1310 nm), splitter insertion loss (typically 3.6 dB for a 1:2 split, cumulative for cascaded splits), connector losses, and the optical power budget of the OLT and ONT equipment. An HLD that specifies 1:64 splitting without verifying the optical link budget on the longest drop in each serving area is a design that may fail in the field. I've seen this exact problem: an operator activates service and discovers that subscribers at the edges of a serving area have 3 to 5 dB of margin deficit. The fix at that point is either cascaded amplification (expensive) or network redesign (worse).
What the HLD-to-LLD Handoff Should Look Like
The quality of the HLD determines how smoothly LLD proceeds. A clean HLD-to-LLD handoff has specific characteristics:
- Defined route centerlines in GIS: not sketched on PDF, but spatially accurate lines that LLD engineers can place poles and splice points along without reinventing the routing.
- Fiber count tables per segment: so LLD engineers know exactly what cable to specify without re-deriving the fiber demand.
- Node and hub locations with equipment specs: what equipment goes where, so LLD can start placement drawings from a defined starting point.
- Construction method specified per segment: so LLD engineers know whether they're designing aerial or underground construction details.
- Risk flags documented: railroad crossings, utility conflicts, make-ready-heavy sections flagged so LLD can sequence those tasks first.
A messy HLD handoff forces LLD engineers to re-answer questions the HLD was supposed to settle. That's wasted time, and it introduces inconsistency: two LLD engineers interpreting an ambiguous HLD often produce different answers. Our fiber network design cost guide covers how this re-work compounds throughout the project budget.
Real-world consequence: On an FTTH project we reviewed, the client's HLD had been produced by a firm that delivered route lines on PDF and a narrative document. When LLD began, engineers spent three weeks resolving ambiguities in fiber counts and node placement before they could start drawing. That's engineering time that added directly to project cost, and pushed the permit application start by almost a month.
How Draftech Delivers HLD Services
Our HLD workflow is self-performed: no subcontractors, no outsourced GIS processing. The team that does the field survey is the same team feeding data into the design, which eliminates the data translation errors that occur when survey data gets handed off between firms.
Workflow and Timeline
A typical FTTH HLD engagement at Draftech runs 5 to 8 weeks for a deployment in the 1,500 to 3,500 subscriber range. Week one is data intake: existing infrastructure data, subscriber location list, any prior survey or engineering records the client has. Weeks two and three are route development and architecture design: feeder routing, node placement, fiber count modeling, PON architecture. Weeks four and five are deliverable development: GIS package, design narrative, cost estimate basis document, and the review cycle. We build in one round of client review with a comment resolution period before final delivery.
Larger projects (multi-county BEAD deployments, projects over 5,000 subscribers, or builds with complex terrain) run 10 to 14 weeks. We staff projects based on scope, not a fixed team size; on a large BEAD HLD, we'll typically have three to five engineers on the project simultaneously working different geographic zones in parallel.
Deliverable Format
Our standard HLD deliverable package includes:
- ESRI File Geodatabase with all route, node, and subscriber data
- PDF map set at county and project-area scale
- Fiber count matrix by segment
- Node and hub schedule with equipment specifications
- Splice point list with coordinates
- Optical link budget worksheets for each PON segment
- Design narrative documenting major decisions and their basis
- Preliminary cost estimate by segment and construction type
For BEAD projects, we format the GIS deliverables to the applicable state broadband office schema as part of the standard package, not as an add-on that gets tacked on at the end.
Revision Cycles
One revision cycle is included in our standard HLD engagement. Revisions requested after the HLD is finalized (because the client's service area changed, or because a competing route was identified after delivery) are scoped and priced separately. We're clear about this upfront because scope creep on HLD work is real, and ambiguous revision policies are one of the most common sources of cost disputes between clients and engineering firms.
Starting an HLD Engagement
If you're preparing for an FTTH build (whether it's BEAD-funded, electric co-op broadband, or a commercial ISP deployment), the HLD is the foundation everything else is built on. The decisions made in the HLD determine construction cost, LLD scope, make-ready requirements, and whether the network actually performs at the subscriber level once it's built.
We work with ISPs, electric cooperatives, and BEAD subgrantees across 24 active states, with our teams deployable to all 50. Projects range from 500-subscriber rural builds to multi-county deployments with 15,000+ subscribers. If you're ready to start an HLD engagement, or if you have an existing HLD you want a second opinion on before LLD begins, reach out at info@draftech.com. Tell us the project size, the target service area, and where you are in the project timeline. We'll respond with a realistic scope and schedule.
More context on our full engineering process is at our OSP engineering services page. If you're budgeting for the full design cycle, our fiber network design cost guide breaks down what to expect across HLD, LLD, and construction support phases.